Nuclear charts
Inspired by others (e.g. Hergert, Front. Phys. 8, 379 (2020)), a few years ago I created a set of nuclear charts to represent the progress in ab initio calculations of atomic nuclei over the years. You can find two examples below.
A few comments:
- The experimental data are taken from the latest Atomic Mass Evaluation (AME) available: M. Wang et al., Chinese Phys. C 45 030003 (2021).
- The data regarding energy density functional (EDF) calculations have been obtained from S. Hilaire (CEA Bruyères-le-Châtel).
- For ab initio methods, I do not apply strict criteria. I consider all nuclei for which a reasonable calculation has been performed.
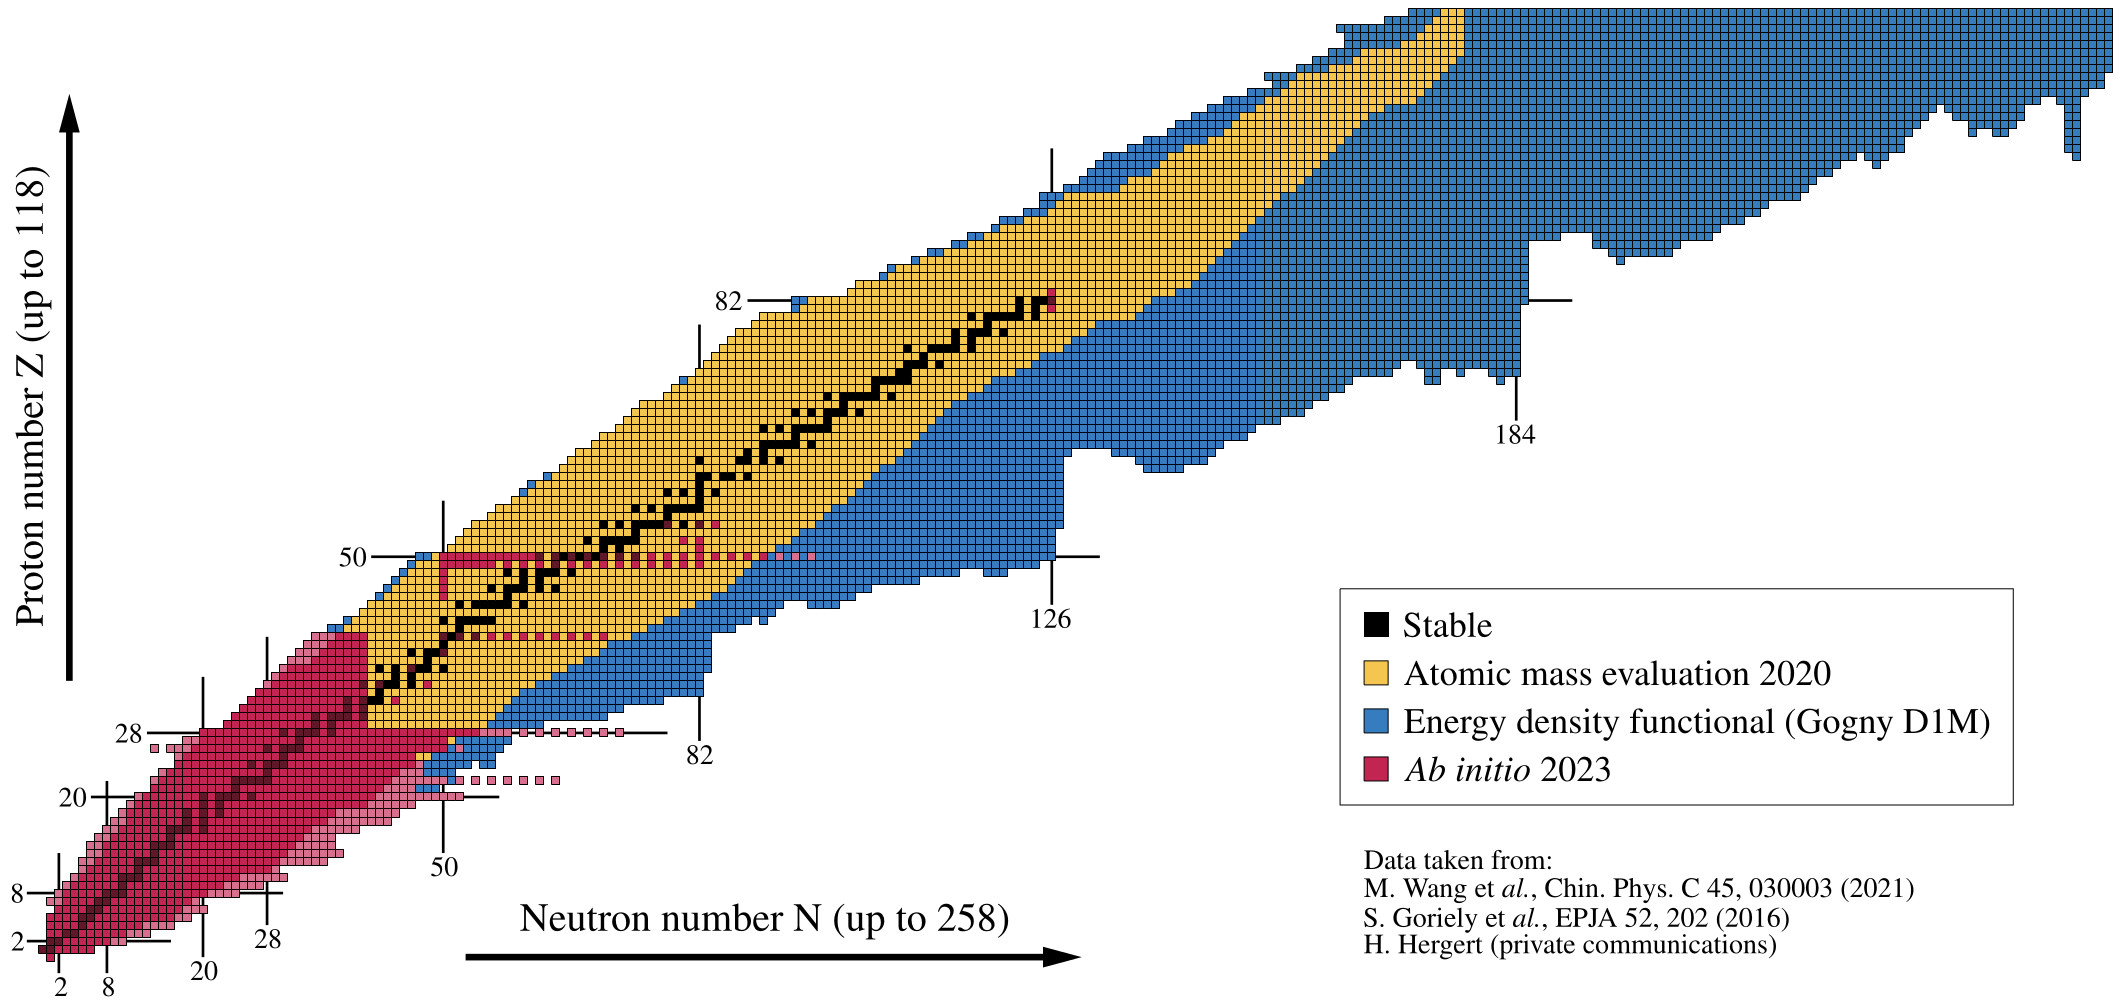 Comparison between data of the Atomic Mass Evaluation of 2020, nuclei predicted to exist by the Gogny D1M energy density functional and ab initio calculations as of 2023.
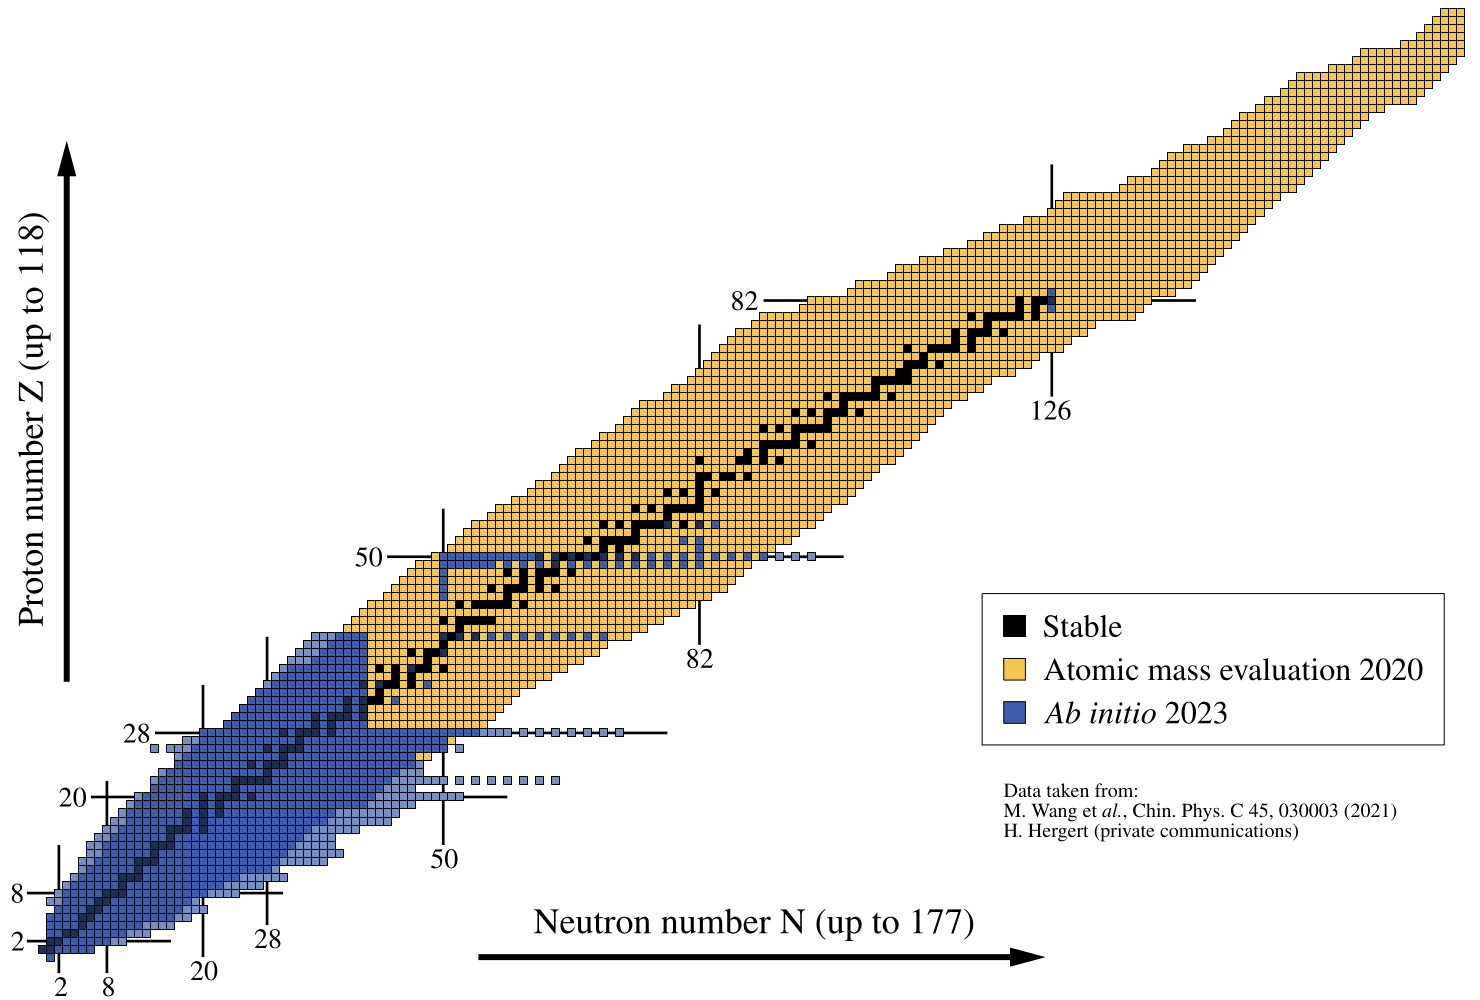 Comparison between data of the Atomic Mass Evaluation of 2020 and ab initio calculations as of 2023.
You can download the PDF of the latest version (07/04/2024) of the nuclear charts here:
(if you use them, please remember to cite me)